At Simula, we believe that if you cannot observe a system, you cannot reliably operate it. We apply that philosophy to all our services, including our managed WordPress hosting service.
That means continuously monitoring not only availability and performance, but also security events, software inventory, configuration changes, and operational health. We want to know what is happening across every WordPress instance we manage, and we want to answer those questions from a single observability platform.
Two Worlds That Didn’t Talk to Each Other
The WordPress sites we host are public-facing and like other sites on the Internet, they are continuously targeted by automated vulnerability scanners, brute-force login attempts, malware campaigns, and countless other attacks. Furthermore, every WordPress site has its own combination of themes and plugins, and therefore its own attack surface.
For us, observability is not separate from security, it is another dimension of understanding the state of the sites we operate.
Servers, containers, databases, reverse proxies, and applications all send their metrics and logs into a centralized stack powered by Prometheus, Grafana, Loki, and Grafana Alloy. WordPress security, however, lived in a different world.
We advice our customers to install and use Wordfence, It is one of the most trusted security solutions in the WordPress ecosystem. Its Web Application Firewall (WAF), malware scanner, integrity checks, and security event logging provide an excellent layer of protection for our customers. We also use Wordfence Central, which gives us a security overview of WordPress instances we provide support to. It enables us to monitor security alerts, verify updates, and quickly identify security issues across our fleet.
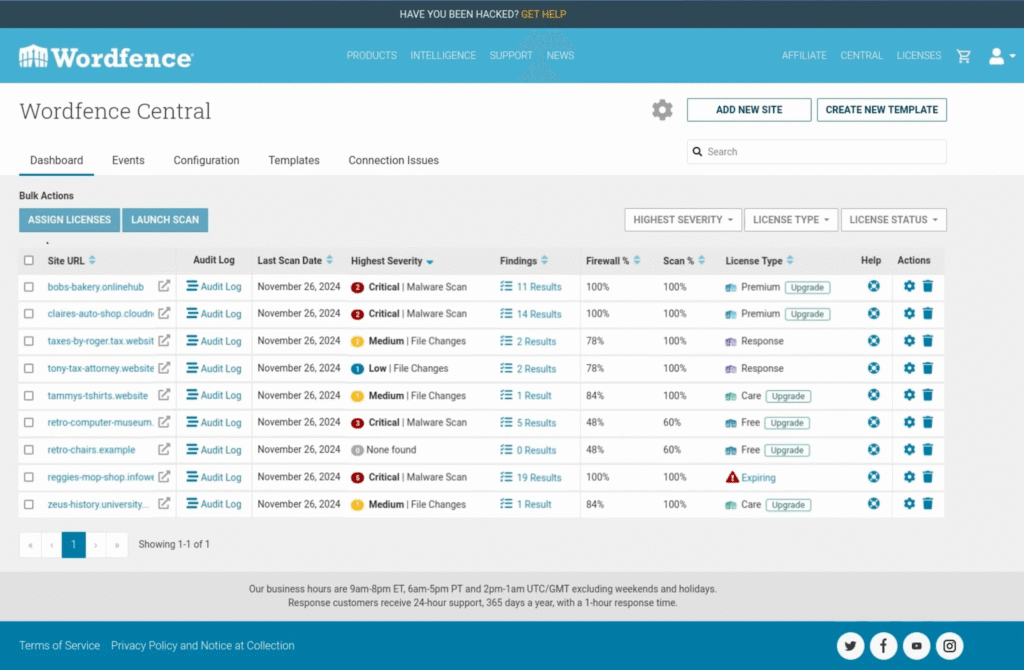
Wordfence and Wordfence Central are excellent at what they do. Nonetheless, our engineers regularly switched between Grafana dashboards, Wordfence Central, and individual WordPress administration panels to understand what was actually happening. The information was there, but correlating it across systems was cumbersome and time-consuming.
We wanted a single operational view.
We wanted WordPress security to become a first-class citizen in our observability platform.
Building the Missing Bridge
Our first thought was that someone had probably solved this already. So we searched for a WordPress plugin that could expose Wordfence metrics in a standard format suitable for Prometheus, Loki and Grafana.
When we couldn’t find one, we built it ourselves. AI made that very affordable.
The first version of the plugin had a very focused objective: export essential Wordfence security metrics so they could be scraped by Prometheus and visualized in Grafana.
It worked, but very quickly we realized something important. Metrics tell us that something is happening. Logs tell us more.
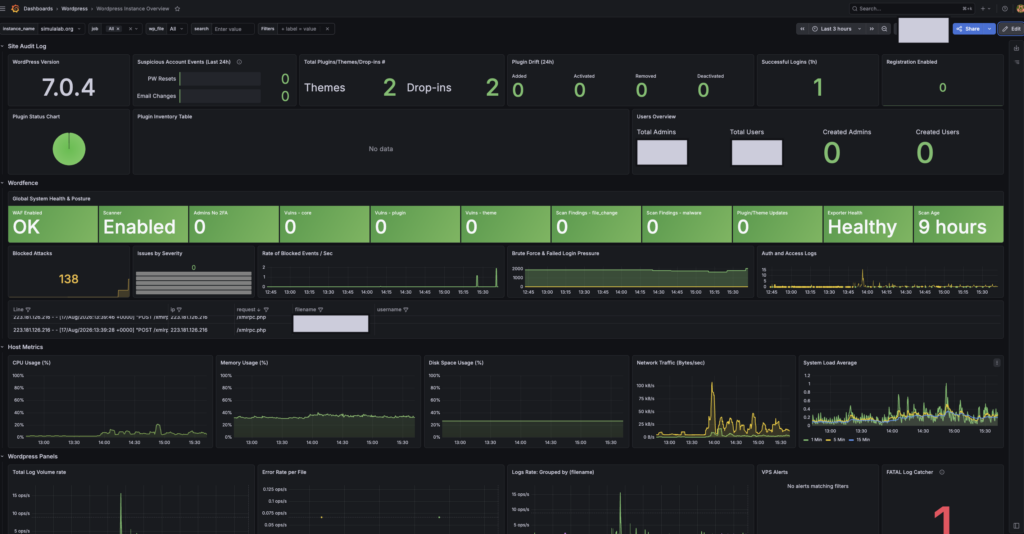
The project naturally expanded to export Wordfence incident logs as well. Using Grafana Alloy, those logs could be forwarded directly into Grafana Loki, allowing our operations team to investigate security incidents without leaving the observability platform they already used every day.
For the first time, WordPress security telemetry could be correlated with infrastructure events, application logs, and system metrics from a single dashboard.
From Security Telemetry to WordPress Observability
Once we had built the foundation, another opportunity became obvious. Running WordPress at scale requires much more than Wordfence security telemetry and logs.
Operational awareness also depends on understanding the state of every installation. Has someone added a new administrator? Was a plugin installed unexpectedly? Are all websites running the expected WordPress version?
In many cases, these questions are just as important as knowing how many attacks were blocked. The plugin therefore evolved beyond exporting Wordfence data.
Version 3.x of the plugin also exports a broad set of operational metrics directly from WordPress itself.
Among the information it exposes are:
- WordPress version
- Installed and active plugins
- Plugin versions
- Plugin drop-ins
- Number of users
- Number of administrator accounts
- Changes in user roles and permissions
- Deviations in user counts
- Security-related configuration information
- Additional operational and inventory metrics
The result is a much richer operational picture.
Instead of logging into dozens of WordPress dashboards individually, administrators can visualize the state of their entire WordPress estate from Grafana.
Beyond day-to-day operations, these metrics can also simplify troubleshooting, asset management, compliance verification, and security investigations.
Built Through Real-World Operations
The plugin grew out of practical operational experience. The first version solved an immediate problem. Versions two and three focused on making the plugin more flexible, reliable, and suitable for production environments.
We introduced configuration options that allow administrators to control collection intervals, choose which metrics are exported, and tailor the telemetry to their monitoring environment.
The plugin evolved from something we primarily needed for our own operations into a tool flexible enough to support organizations with very different monitoring and operational requirements.
One incident that clearly demonstrated the value of centralized observability was the disclosure of the wp2shell vulnerability.
The telemetry exported by the plugin allowed us to quickly verify the relevant software versions across every WordPress installation we provide support to. At the same time, our broader observability platform enabled us to review historical activity for possible exploitation attempts and monitor ongoing activity as the situation developed.
That visibility helped us stay ahead of the incident.
The observability layer did not prevent the vulnerability itself. What it provided was immediate operational visibility and confidence that all instances were already in the desired state.
It is In The Open-Source Domain
Today, Simula Security Telemetry for Wordfence v3.2.3 is publicly available through the official WordPress Plugin Directory. The source code is also hosted on GitHub.
Releasing the plugin as open-source is one way for us to contribute back to the open-source ecosystem that we rely on and value.
It also allows the wider community to inspect the code, use it in different environments, contribute improvements, and help shape its future.
We hope it proves useful to IT-admins, IT consultants, managed hosting providers, DevOps engineers, security professionals, and anyone responsible for operating WordPress at scale.