
Description
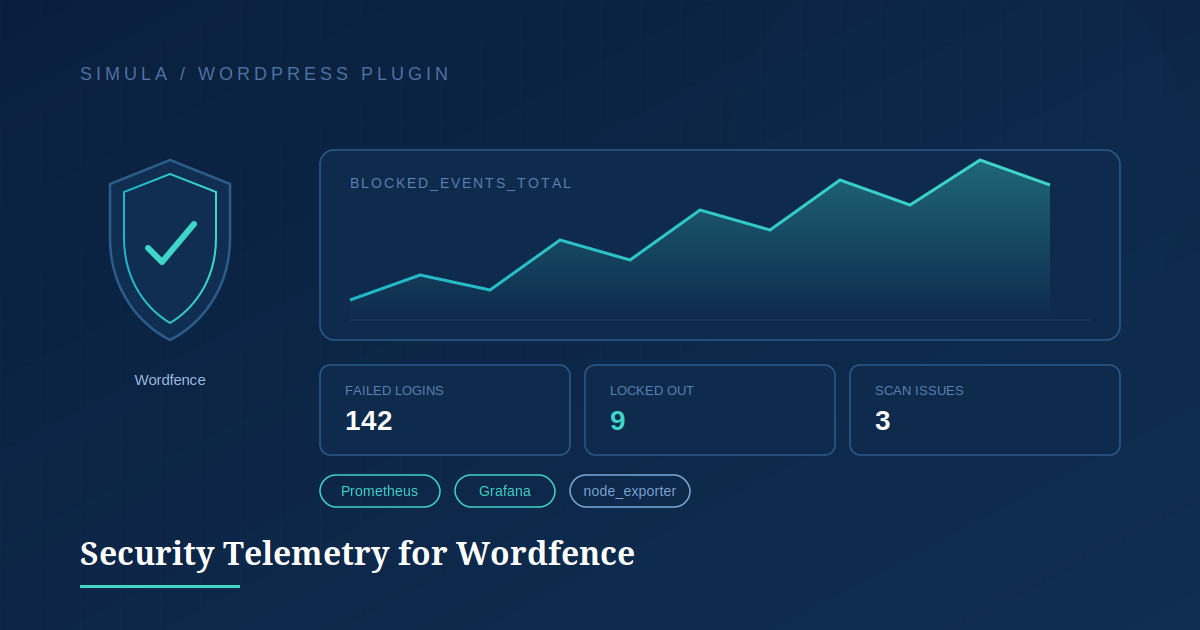
Simula Security Telemetry for Wordfence exports Wordfence security telemetry in two forms:
- Prometheus metrics for the node_exporter textfile collector that can be scraped by Prometheus
- A local incident log containing blocked Wordfence requests that can be shipped with Grafana-Alloy
This plugin is intended for WordPress sites that already use Wordfence and Prometheus-based infrastructure. Instead of exposing a public metrics endpoint from WordPress, the plugin writes local files that node_exporter and log-based tooling can consume.
By default, the plugin runs a fast collector every 15 minutes and a slow collector hourly using WP-Cron. It supports:
- Exporter health and plugin metadata metrics
- Configurable cron interval
- Separate fast and slow collector intervals
- Per-metric-family enable or disable controls
- Blocked event counters and recent activity windows
- Blocked event counts by HTTP status code over the last 24 hours
- Failed login, rate-limited, and brute-force activity windows
- Current lockout counts for IPs and users
- Wordfence two-factor status and protected user counts
- Scan issue counts by severity
- Malware, file change, and vulnerable component findings
- Top blocked attack sources by country and normalized IP range
- Incident log export for newly observed blocked requests
- Incident privacy controls for IPs, URLs, referers, user agents, and internal traffic
- Manual export and incident cursor reset from the admin UI
- Current exporter and incident state visibility in the admin UI
- Optional JSON Lines incident output
- WP-CLI exports for system cron
- Source freshness and WordPress/Wordfence posture metrics
- A ready-to-import Grafana dashboard and sample Prometheus alert rules
Blocked events are currently identified from the Wordfence hits table, where:
- action matches blocked:*
- or the HTTP status code is 403 or 503
The plugin includes an admin settings screen under Settings > Security Telemetry, where you can:
- Enable or disable the exporter master switch
- Choose the export cron interval
- Choose the slow collector interval
- Set the .prom output path
- Set a custom metric prefix
- Set a custom site label
- Enable or disable individual metric families
- Enable or disable incident log export
- Set the incident log path
- Choose text or JSON Lines incident output
- Limit the number of incidents appended per run
- Configure incident IP privacy and field-dropping filters
- Add an optional retention note to emitted incident events
- Trigger a manual export
- Reset the incident cursor for backfill
- Review the current exporter and the incident state
Meta
- Version 3.1.2
- Last updated 06 Aug 2026 • 10:30 UTC
- Active installations 50+
- WordPress version 6.0 or higher
- Tested up to 7.0
- PHP version 7.4 or higher
- Tags: Grafana, Metrics, Monitoring, Security, Wordfence
- Advanced View
Installation
- Upload the plugin folder to the /wp-content/plugins/directory, or install it using your preferred deployment process.
- Activate the plugin through the Plugins screen in WordPress.
- Go to Settings > Security Telemetry.
- Set the Prometheus output file path. The default is /var/lib/node_exporter/textfile_collector/wordfence.prom.
- Ensure the target directory already exists and is writable by the PHP process.
- If incident export is enabled, set the incident log path. The default is /var/log/wordpress-wordfence-incidents.log.
- Ensure the incident log directory already exists and is writable by the PHP process.
- Ensure node_exporter is configured with the textfile collector and can read the generated .prom file.
Support
Got something to say? Need help?
Donate
Would you like to support the advancement of this plugin?
FAQ
Does this plugin expose a public metrics endpoint?
No. The plugin does not expose a public metrics endpoint. Instead, it writes Prometheus metrics to a local file for the node_exporter textfile collector and can optionally append blocked incidents to a local log file for collection by tools such as Grafana Alloy.
Does this plugin require Wordfence?
Yes. The plugin reads security telemetry directly from Wordfence data stored in the WordPress database. If the required Wordfence tables or columns are unavailable, the exporter emits failure-state metrics to indicate the issue rather than silently failing.
How often are metrics exported?
By default, the plugin performs a fast export every 15 minutes and a slow export every hour using WP-Cron. Export intervals can be customized from the settings page, with supported fast intervals of 5, 15, and 30 minutes or hourly, and slow intervals of hourly, twice daily, or daily.
What metrics does the plugin export?
The plugin exports a wide range of Wordfence security and operational metrics, including exporter health, blocked requests, failed logins, brute-force activity, lockouts, two-factor authentication status, scan findings, malware detections, vulnerable components, update availability, and Wordfence security posture metrics. Individual metric families can be enabled or disabled independently.
What does the incident log export do?
The incident log exporter records newly observed blocked Wordfence requests to a local log file. Logs can be written in plain text or JSON Lines format and consumed by observability platforms such as Loki, ELK, OpenSearch, and Grafana. Privacy controls are available for IP addresses, URLs, referers, and user agents.
What WP-CLI commands are available?
The plugin provides WP-CLI commands to run exports, export only specific metric scopes, export incidents, reset the incident cursor, and view exporter status.
Does the plugin include Grafana and Prometheus assets?
Yes. The plugin includes a ready-to-import Grafana dashboard and sample Prometheus alert rules to help you visualize and monitor Wordfence security telemetry.
What permissions are required?
The directory used to store the exported .prom metrics file must already exist and be writable by the PHP process running WordPress. If incident logging is enabled, the log directory must also exist and be writable. The resulting metrics file must be readable by node_exporter.
Contributors & Developers
Translate “Simula Security Telemetry for Wordfence” into your language.
Interested in development?
Browse the code, check out the SVN repository, or subscribe to the development log by RSS.
Changelog
v3.1.2
- Added Wordfence Firewall Summary-compatible aggregate block metrics by category and 24h, 7d, and 30d reporting window.
- Added explicit blocked_hit_rows aliases for the existing hit/live-traffic row metrics while keeping blocked_events metrics for compatibility.
- Added Firewall Summary source availability, collection-success, source-info, and latest-bucket diagnostics.
v3.0.0:
- Added WordPress core version metadata through wordpress_wordfence_wordpress_version_info.
- Added installed plugin aggregate metrics for installed, active, inactive, and network-active plugin totals.
- Added opt-in per-plugin inventory metrics with plugin file, name, version, active state, and update availability labels.
- Added opt-in administrator inventory metrics with hashed identity labels by default and per-admin Wordfence two-factor status.
- Added WordPress settings, role/user, plugin/theme drift, account event, cron/option persistence, content injection, and uploads/file IoC metric families.
- Added administrator identity label modes for hashed, ID-only, and counts-only operation.
2.3.3
- Added clearer stale-export diagnostics via the next scheduled fast and slow export timestamps, plus richer admin and WP-CLI freshness status output.
- Fixed scan finding classification so malware counts prefer structured Wordfence issue types instead of broad message text matches.
- Reduced false malware positives due to non-malware scan issues, such as skipped scan paths and unknown files.
2.2.2
- Fixed incident log timestamps to prefer the original Wordfence hit timestamp over the export run time.
- Added bounded INFO, WARN, and CRITICAL levels to Wordfence incident log events.
- Added dashboard filtering by instance_name across metrics and incident logs.
- Renamed the plugin, admin page slug, option keys, cron hooks, and WP-CLI command to the Simula Security Telemetry naming.
2.1.0
- Added incident privacy controls for IPs, URL and referer query strings, referers, user agents, private/internal IP ranges, and retention notes.
2.0.0
- Changed the default fast export interval to 15 minutes.
- Added a slow collector for scan, two-factor, WordPress posture, and Wordfence posture metrics.
- Added WP-CLI export, status, and incident cursor commands.
- Added optional JSON Lines incident output.
- Added source freshness, Wordfence posture, and WordPress posture metrics.
- Replaced unbounded error message labels with bounded error type labels.
- Added a Grafana dashboard and sample Prometheus alert rules.
1.0.0
- Added configurable WP-Cron export intervals.
- Added per-metric-family enable and disable controls.
- Added incident log export for blocked Wordfence requests.
- Added incident cursor tracking and manual cursor reset for backfill.
- Added current exporter and incident state visibility in the admin UI.
- Added expanded Wordfence telemetry, including failed logins, rate limiting, brute force activity, lockouts, two-factor coverage, scan findings, and top attack sources.