
WordPress Plugin · Security & Observability
Simula Security Telemetry for Wordfence
Turn Wordfence’s activity log into Prometheus metrics and a clean incident log — without exposing a public endpoint from your WordPress install.
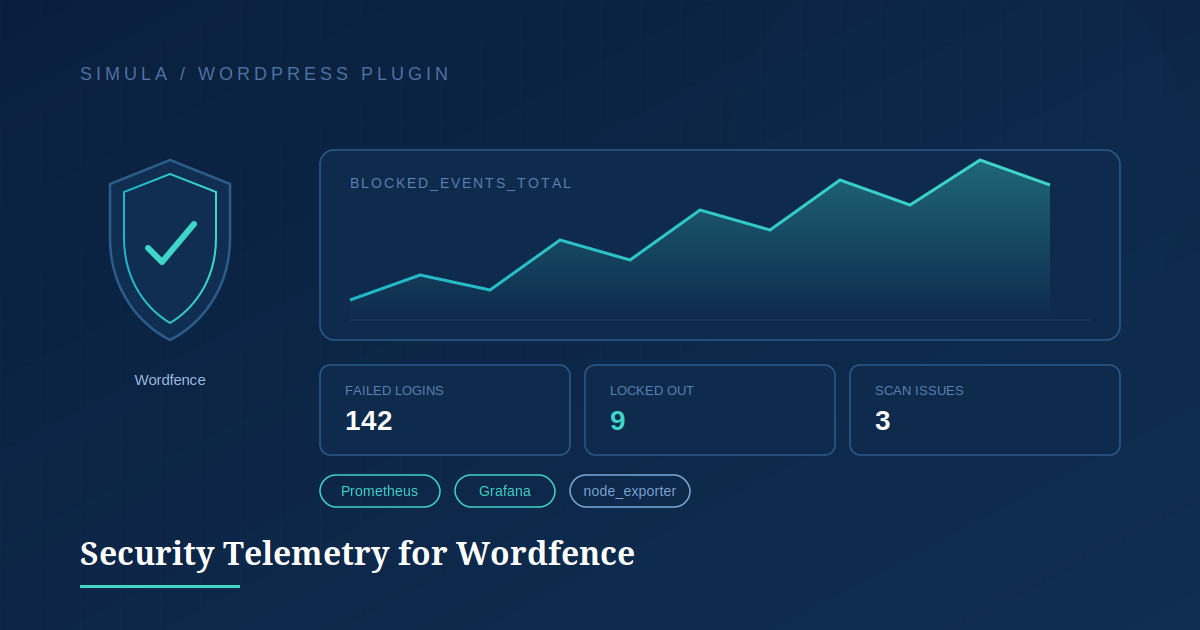
Wordfence collects a lot of useful security signal, but most of it stays locked inside the WordPress admin. Simula Security Telemetry for Wordfence exports that data on a schedule into two operator-friendly formats: a Prometheus textfile for node_exporter, and an append-only incident log for Loki, ELK, or OpenSearch.
How data flows
STEP 1
Wordfence logs hits to its DB tables
STEP 2
Plugin writes .prom + incident log files
STEP 3
node_exporter + Prometheus + Grafana
What it tracks
Attack Activity
Blocked hits, failed logins, rate-limiting, and brute-force windows over 5m/1h/24h/7d.
Access & Scans
Lockout counts, 2FA coverage, malware findings, and vulnerable plugin/theme counts.
Site Posture
Firewall status, available core/plugin/theme updates, admin accounts without 2FA.
Sample incident line
[23-May-2026 12:34:56 UTC] CRITICAL blocked request: ip="203.0.113.10" status=403 action="blocked:waf" reason="SQL injection attempt" url="/wp-admin/admin-ajax.php" country="NO"
Requirements
- WordPress 6.0+
- PHP 7.4+
- Wordfence active
node_exportertextfile collector enabled
Setup
- Install & activate the plugin
- Go to Settings → Security Telemetry
- Set your
.promand log paths - Point Prometheus at
node_exporter
WP-CLI ready: wp simula-security-telemetry export · reset-cursor · status — ideal for system cron on low-traffic sites.
Developed by Simula Lab Ltd · Licensed GPL-2.0-or-later